It doesn’t matter how much you earn. If your expenses are more than your income, you’re still in debt unless you change our spending habits.
Keeping Track of your money could be the gateway to getting Rich.
Instructions to Use the Template
Adding Income and Expenses
After downloading and extracting the folder, you'll get the excel sheet file.
On opening, you'll see such dashboard.
It's simple and clean, and almost explanatory itself.
At the top left, you'll be shown summary (Income and Expense on that month). And on the right you'll see the bar chart of Income vs Expense.
You don't need to add the data on Summary part.
Once you start adding the data on Income and Expense section down below, the summary section with the chart will populate itself.
You just need to add the data on Income (Green Background) and Expense (Red Background) section down below
Next Months
You'll be adding Income and Expense data on new sheet every month.
And you don't need to create sheets for those months, it's already created.
If you look at the bottom of the sheet, you can see the name of all 12 months.
On clicking on each tab opens new sheet with empty cells.
Adding Categories (Income and Expenses)
While adding Income and Expense, you need to select category as well.
They are pre populated on dropdown but you can add yours as well, from Categories tab (Shown on Purple Border).
Summary and Charts
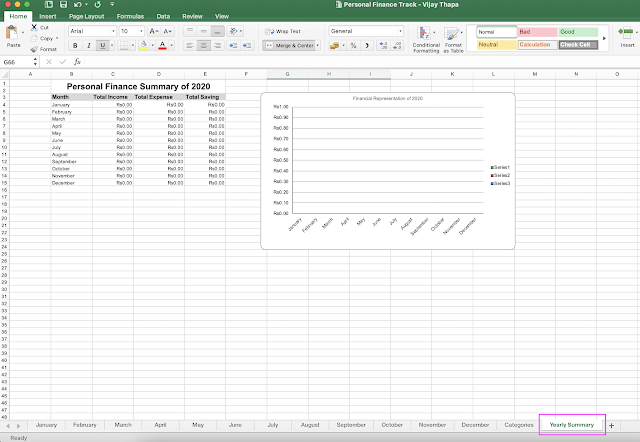
To see the summary of whole year, you can just visit the Yearly Summary Tab.
It will show you thee Total Income, Total Expense and Total Savings of all 12 months along with a bar chart.
Hope this template will be helpful to you and you save tons of money.
Best Wishes!
Also if you want to Visualize this Data and generate advanced charts and reports, then follow the link below.
Free Tutorial on Data Visualization


![Advertisement [ad]](https://blogger.googleusercontent.com/img/a/AVvXsEgVAiCox6-vLXsNZas8ks-nfos0PgdnL4yClmlqOkl92t7zGdYYiLBy9AHMZFxBYe06DVmN6JGQ9S0P3iClXk8l43FIQPDyAcx_uMmV0bN9JlKjTzOAi7YjmQo6cuvHgkEO76L-hcqV-TWE29v93eeFby8MOAOuJ8DcilHTPpfP8aKg8TG9uYCDaMxcr8H1=s600)

Comments